Examples
| Chicken E3 embryo | |
| Chicken E3 aorta | |
| Chicken E3 anterior slice | |
| Zebrafish 40 hpf whole embryo | |
| Zebrafish 28 hpf trunk | |
| Mouse E10.5 slice | |
| Human 35-day slice |
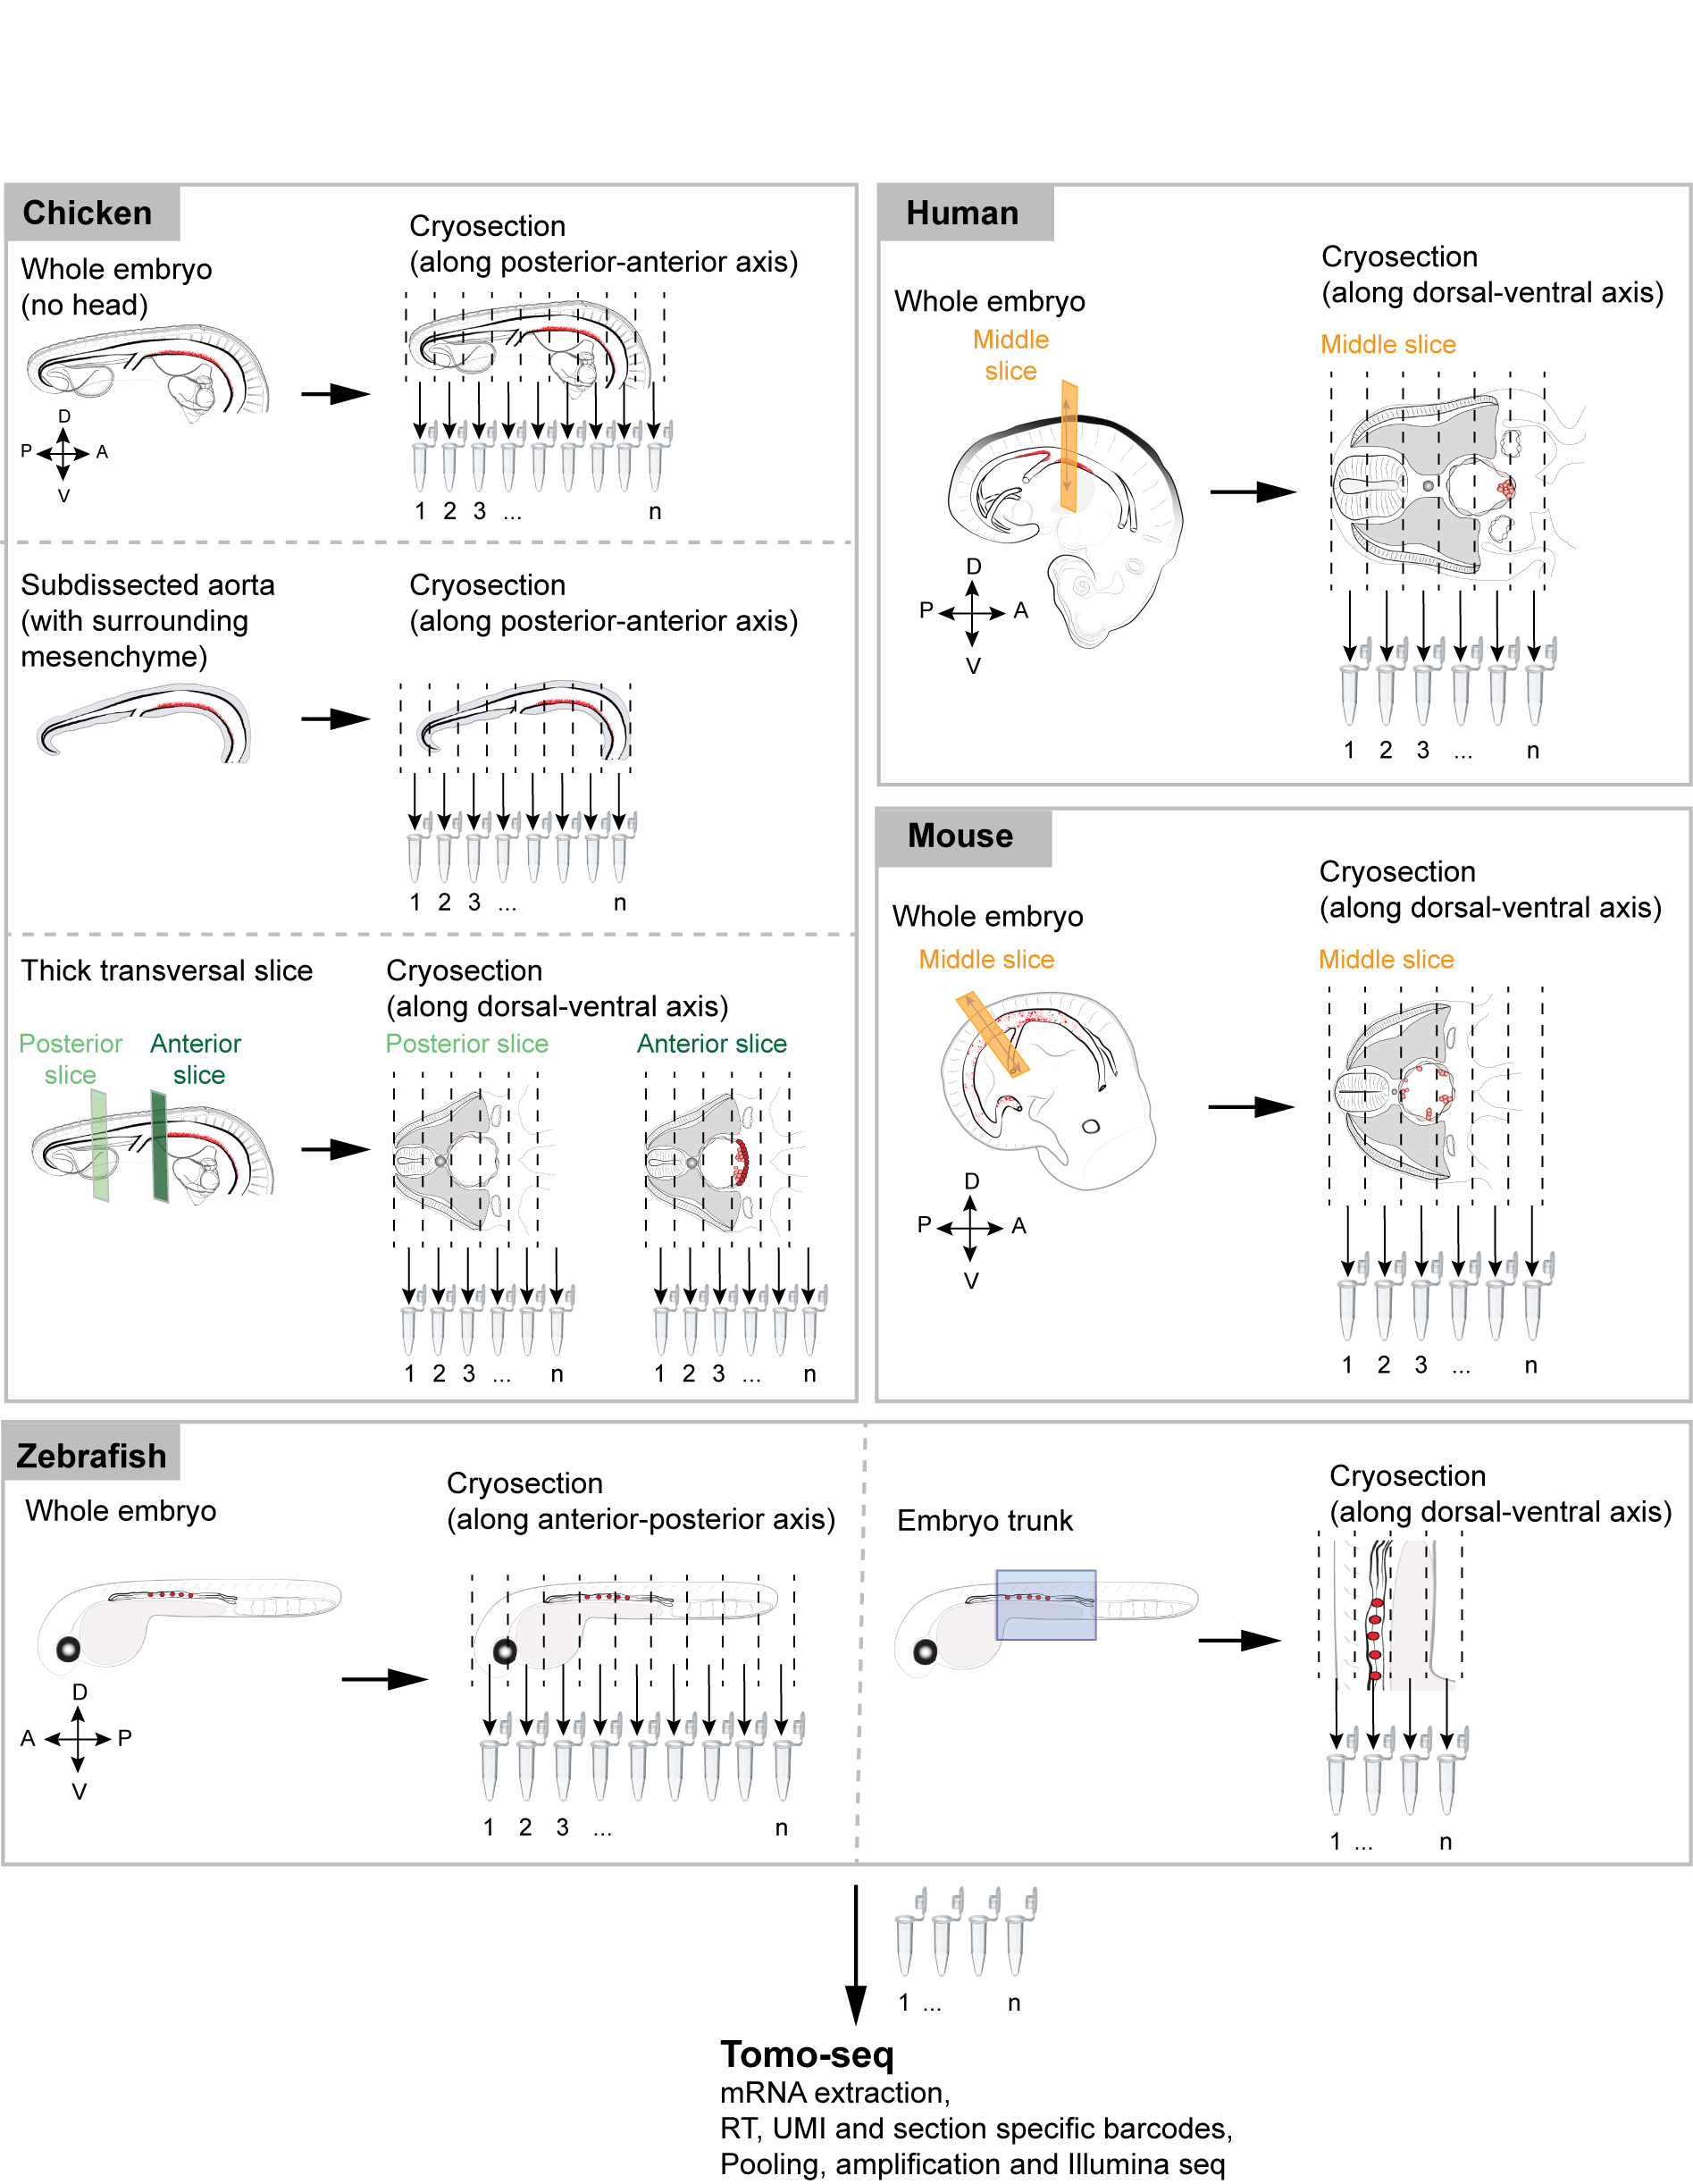
Spatial transcriptomics of zebrafish, chicken, mouse and human embryos
RNA tomography sequencing (tomo-seq) combines cryosectioning and low input RNA sequencing techniques. Transcriptome wide gene expression maps were created to provide information about any gene expressed along a pre-determined axis of multi-species embryos isolated at precise time points of development. We applied the tomo-seq method on:
- Whole chicken embryos, isolated at embryonic day (E)3.
- Subdissected aorta dissected from an E3 chicken embryo.
- Transversal slices collected in the anterior and posterior portions of chicken embryos, isolated at E3 and E4.
- Whole zebrafish embryos, isolated at 28 hours post fertilization (hpf) and 40 hpf.
- Trunk regions of zebrafish embryos, isolated at 28 hpf and 40 hpf.
- Transversal slices collected in the middle portion of mouse embryos, isolated at E10.5 and E11.5.
- Transversal slices collected in the middle portion of a 35-day old human embryo.
We generated high-resolution anterior to posterior and/or dorsal to ventral gene expression maps (Yvernogeau et al., submitted). Here, we provide these gene expression maps to the community for open exploration.
The gene expression maps can be explored by entering a gene name, a species type, a developmental time point and/or a sample type, which provides information on:
- Expression along the anterior-posterior axis (for zebrafish and chicken embryos) and dorsal-ventral axis (for zebrafish, chicken, mouse and human embryos).
- Expression in the individual species expression maps, displayed as z-score normalized expression. TMP normalized expression is available as a download.
- Spatially co-expressed genes based on similarity in expression patterns at a user defined correlation threshold. The expression of co-expressed genes is shown graphically and all correlation coefficients can be downloaded in table format.
Reference: Yvernogeau, L., Morin-Poulard, I., Klaus, A., Maas, J., Schulte-Merker, S., Berezikov, E., Junker, J.P., and Robin, C. Multi-species tomo-sequencing identifies new major hematopoietic stem cell regulators in the microenvironment of the embryonic aorta. Submitted.
Outline of the RNA tomography method
Robin Lab - 2019 © Hubrecht Institute | Berezikov Lab - 2019 © ERIBA